使用 trace-cmd 追蹤內核

在 之前的文章 里,我介紹了如何利用 ftrace 來追蹤內核函數。通過寫入和讀出文件來使用 ftrace 會變得很枯燥,所以我對它做了一個封裝來運行帶有選項的命令,以啟用和禁用追蹤、設置過濾器、查看輸出、清除輸出等等。
trace-cmd 命令是一個可以幫助你做到這一點的工具。在這篇文章中,我使用 trace-cmd 來執行我在 ftrace 文章中所做的相同任務。由於會經常參考那篇文章,建議在閱讀這篇文章之前先閱讀它。
安裝 trace-cmd
本文中所有的命令都運行在 root 用戶下。
因為 ftrace 機制被內置於內核中,因此你可以使用下面的命令進行驗證它是否啟用:
# mount | grep tracefs
none on /sys/kernel/tracing type tracefs (rw,relatime,seclabel)
不過,你需要手動嘗試安裝 trace-cmd 命令:
# dnf install trace-cmd -y
列出可用的追蹤器
當使用 ftrace 時,你必須查看文件的內容以了解有哪些追蹤器可用。但使用 trace-cmd,你可以通過以下方式獲得這些信息:
# trace-cmd list -t
hwlat blk mmiotrace function_graph wakeup_dl wakeup_rt wakeup function nop
啟用函數追蹤器
在我 之前的文章 中,我使用了兩個追蹤器,在這裡我也會這麼做。用 function 啟用你的第一個追蹤器:
$ trace-cmd start -p function
  plugin 'function'
查看追蹤輸出
一旦追蹤器被啟用,你可以通過使用 show 參數來查看輸出。這隻顯示了前 20 行以保持例子的簡短(見我之前的文章對輸出的解釋):
# trace-cmd show | head -20
## tracer: function
#
# entries-in-buffer/entries-written: 410142/3380032   #P:8
#
#                                _-----=> irqs-off
#                               / _----=> need-resched
#                              | / _---=> hardirq/softirq
#                              || / _--=> preempt-depth
#                              ||| /     delay
#           TASK-PID     CPU#  ||||   TIMESTAMP  FUNCTION
#              | |         |   ||||      |         |
           gdbus-2606    [004] ..s. 10520.538759: __msecs_to_jiffies <-rebalance_domains
           gdbus-2606    [004] ..s. 10520.538760: load_balance <-rebalance_domains
           gdbus-2606    [004] ..s. 10520.538761: idle_cpu <-load_balance
           gdbus-2606    [004] ..s. 10520.538762: group_balance_cpu <-load_balance
           gdbus-2606    [004] ..s. 10520.538762: find_busiest_group <-load_balance
           gdbus-2606    [004] ..s. 10520.538763: update_group_capacity <-update_sd_lb_stats.constprop.0
           gdbus-2606    [004] ..s. 10520.538763: __msecs_to_jiffies <-update_group_capacity
           gdbus-2606    [004] ..s. 10520.538765: idle_cpu <-update_sd_lb_stats.constprop.0
           gdbus-2606    [004] ..s. 10520.538766: __msecs_to_jiffies <-rebalance_domains
停止追蹤並清除緩衝區
追蹤將會在後台繼續運行,你可以繼續用 show 查看輸出。
要停止追蹤,請運行帶有 stop 參數的 trace-cmd 命令:
# trace-cmd stop
要清除緩衝區,用 clear 參數運行它:
# trace-cmd clear
啟用函數調用圖追蹤器
運行第二個追蹤器,通過 function_graph 參數來啟用它。
# trace-cmd start -p function_graph
  Plugin 'function_graph'
再次使用 show 參數查看輸出。正如預期的那樣,輸出與第一次追蹤輸出略有不同。這一次,它包括一個函數調用鏈:
# trace-cmd show | head -20
## tracer: function_graph
#
# CPU  DURATION                  FUNCTION CALLS
# |     |   |                     |   |   |   |
 4)   0.079 us    |        } /* rcu_all_qs */
 4)   0.327 us    |      } /* __cond_resched */
 4)   0.081 us    |      rcu_read_unlock_strict();
 4)               |      __cond_resched() {
 4)   0.078 us    |        rcu_all_qs();
 4)   0.243 us    |      }
 4)   0.080 us    |      rcu_read_unlock_strict();
 4)               |      __cond_resched() {
 4)   0.078 us    |        rcu_all_qs();
 4)   0.241 us    |      }
 4)   0.080 us    |      rcu_read_unlock_strict();
 4)               |      __cond_resched() {
 4)   0.079 us    |        rcu_all_qs();
 4)   0.235 us    |      }
 4)   0.095 us    |      rcu_read_unlock_strict();
 4)               |      __cond_resched() {
使用 stop 和 clear 命令來停止追蹤和清除緩存區:
# trace-cmd stop
# trace-cmd clear
調整追蹤以增加深度
如果你想在函數調用中看到更多的深度,你可以對追蹤器進行調整:
# trace-cmd start -p function_graph --max-graph-depth 5
  plugin 'function_graph'
現在,當你將這個輸出與你之前看到的進行比較時,你應該看到更多的嵌套函數調用:
# trace-cmd show | head -20
## tracer: function_graph
#
# CPU  DURATION                  FUNCTION CALLS
# |     |   |                     |   |   |   |
 6)               |        __fget_light() {
 6)   0.804 us    |          __fget_files();
 6)   2.708 us    |        }
 6)   3.650 us    |      } /* __fdget */
 6)   0.547 us    |      eventfd_poll();
 6)   0.535 us    |      fput();
 6)               |      __fdget() {
 6)               |        __fget_light() {
 6)   0.946 us    |          __fget_files();
 6)   1.895 us    |        }
 6)   2.849 us    |      }
 6)               |      sock_poll() {
 6)   0.651 us    |        unix_poll();
 6)   1.905 us    |      }
 6)   0.475 us    |      fput();
 6)               |      __fdget() {
了解可被追蹤的函數
如果你想只追蹤某些函數而忽略其他的,你需要知道確切的函數名稱。你可以用 list -f 參數來得到它們。例如搜索常見的內核函數 kmalloc,它被用來在內核中分配內存:
# trace-cmd list -f | grep kmalloc
bpf_map_kmalloc_node
mempool_kmalloc
__traceiter_kmalloc
__traceiter_kmalloc_node
kmalloc_slab
kmalloc_order
kmalloc_order_trace
kmalloc_large_node
__kmalloc
__kmalloc_track_caller
__kmalloc_node
__kmalloc_node_track_caller
[...]
下面是我的測試系統中可被追蹤的函數總數:
# trace-cmd list -f | wc -l
63165
追蹤內核模塊相關的函數
你也可以追蹤與特定內核模塊相關的函數。假設你想追蹤 kvm 內核模塊相關的功能,你可以通過以下方式來實現。請確保該模塊已經載入:
# lsmod | grep kvm_intel
kvm_intel 335872 0
kvm 987136 1 kvm_intel
再次運行 trace-cmd,使用 list 參數,並從輸出結果中,grep 查找以 ] 結尾的行。這將過濾掉內核模塊。然後 grep 內核模塊 kvm_intel ,你應該看到所有與該內核模塊有關的函數。
# trace-cmd list -f | grep ]$  | grep kvm_intel
vmx_can_emulate_instruction [kvm_intel]
vmx_update_emulated_instruction [kvm_intel]
vmx_setup_uret_msr [kvm_intel]
vmx_set_identity_map_addr [kvm_intel]
handle_machine_check [kvm_intel]
handle_triple_fault [kvm_intel]
vmx_patch_hypercall [kvm_intel]

[...]

vmx_dump_dtsel [kvm_intel]
vmx_dump_sel [kvm_intel]
追蹤特定函數
現在你知道了如何找到感興趣的函數,請用一個例子把這些內容用於時間。就像前面的文章一樣,試著追蹤與文件系統相關的函數。我的測試系統上的文件系統是 ext4。
這個過程略有不同;你在運行命令時,不使用 start 參數,而是在 record 參數後面加上你想追蹤的函數的「模式」。你還需要指定你想要的追蹤器;在這種情況下,就是 function_graph。該命令會繼續記錄追蹤,直到你用 Ctrl+C 停止它。所以幾秒鐘後,按 Ctrl+C 停止追蹤:
# trace-cmd list -f | grep ^ext4_

# trace-cmd record -l ext4_* -p function_graph
  plugin 'function_graph'
Hit Ctrl^C to stop recording
^C
CPU0 data recorded at offset=0x856000
    8192 bytes in size
[...]
查看追蹤記錄
要查看你之前的追蹤記錄,運行帶有 report 參數的命令。從輸出結果來看,很明顯過濾器起作用了,你只看到 ext4 相關的函數追蹤:
# trace-cmd report | head -20
[...]
cpus=8
       trace-cmd-12697 [000] 11303.928103: funcgraph_entry:                   |  ext4_show_options() {
       trace-cmd-12697 [000] 11303.928104: funcgraph_entry:        0.187 us   |    ext4_get_dummy_policy();
       trace-cmd-12697 [000] 11303.928105: funcgraph_exit:         1.583 us   |  }
       trace-cmd-12697 [000] 11303.928122: funcgraph_entry:                   |  ext4_create() {
       trace-cmd-12697 [000] 11303.928122: funcgraph_entry:                   |    ext4_alloc_inode() {
       trace-cmd-12697 [000] 11303.928123: funcgraph_entry:        0.101 us   |      ext4_es_init_tree();
       trace-cmd-12697 [000] 11303.928123: funcgraph_entry:        0.083 us   |      ext4_init_pending_tree();
       trace-cmd-12697 [000] 11303.928123: funcgraph_entry:        0.141 us   |      ext4_fc_init_inode();
       trace-cmd-12697 [000] 11303.928123: funcgraph_exit:         0.931 us   |    }
       trace-cmd-12697 [000] 11303.928124: funcgraph_entry:        0.081 us   |    ext4_get_dummy_policy();
       trace-cmd-12697 [000] 11303.928124: funcgraph_entry:        0.133 us   |    ext4_get_group_desc();
       trace-cmd-12697 [000] 11303.928124: funcgraph_entry:        0.115 us   |    ext4_free_inodes_count();
       trace-cmd-12697 [000] 11303.928124: funcgraph_entry:        0.114 us   |    ext4_get_group_desc();
追蹤一個特定的 PID
假設你想追蹤與一個進程(PID)有關的函數。打開另一個終端,注意運行中的 shell 的PID:
# echo $$
10885
再次運行 record 命令,用 -P 選項傳遞PID。這一次,讓終端運行(也就是說,先不要按 Ctrl+C ):
# trace-cmd record -P 10885 -p function_graph
  Plugin 'function_graph'
Hit Ctrl^C to stop recording
在 shell 上運行一些命令
移動到另一個終端,在那裡你有一個以特定 PID 運行的 shell,並運行任何命令,例如,ls 命令用來列出文件:
# ls
Temp-9b61f280-fdc1-4512-9211-5c60f764d702
tracker-extract-3-files.1000
v8-compile-cache-1000
[...]
移動到你啟用追蹤的終端,按 Ctrl+C 停止追蹤:
# trace-cmd record -P 10885 -p function_graph
  plugin 'function_graph'
Hit Ctrl^C to stop recording
^C
CPU1 data recorded at offset=0x856000
    618496 bytes in size
[...]
在追蹤的輸出中,你可以看到左邊是 PID 和 Bash shell,右邊是與之相關的函數調用。這對於縮小你的追蹤範圍是非常方便的:
# trace-cmd report  | head -20

cpus=8
          <idle>-0     [001] 11555.380581: funcgraph_entry:                   |  switch_mm_irqs_off() {
          <idle>-0     [001] 11555.380583: funcgraph_entry:        1.703 us   |    load_new_mm_cr3();
          <idle>-0     [001] 11555.380586: funcgraph_entry:        0.493 us   |    switch_ldt();
          <idle>-0     [001] 11555.380587: funcgraph_exit:         7.235 us   |  }
            bash-10885 [001] 11555.380589: funcgraph_entry:        1.046 us   |  finish_task_switch.isra.0();
            bash-10885 [001] 11555.380591: funcgraph_entry:                   |  __fdget() {
            bash-10885 [001] 11555.380592: funcgraph_entry:        2.036 us   |    __fget_light();
            bash-10885 [001] 11555.380594: funcgraph_exit:         3.256 us   |  }
            bash-10885 [001] 11555.380595: funcgraph_entry:                   |  tty_poll() {
            bash-10885 [001] 11555.380597: funcgraph_entry:                   |    tty_ldisc_ref_wait() {
            bash-10885 [001] 11555.380598: funcgraph_entry:                   |      ldsem_down_read() {
            bash-10885 [001] 11555.380598: funcgraph_entry:                   |        __cond_resched() {
試一試
這些簡短的例子顯示了使用 trace-cmd 命令而不是底層的 ftrace 機制,是如何實現既容易使用又擁有豐富的功能,許多內容本文並沒有涉及。要想了解更多信息並更好地使用它,請查閱它的手冊,並嘗試使用其他有用的命令。
via: https://opensource.com/article/21/7/linux-kernel-trace-cmd
作者:Gaurav Kamathe 選題:lujun9972 譯者:萌新阿岩 校對:wxy
本文轉載來自 Linux 中國: https://github.com/Linux-CN/archive
對這篇文章感覺如何?
You may also like


More in:Linux中國

捐贈 Let's Encrypt,共建安全的互聯網
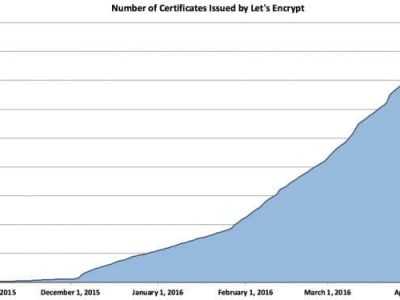
Let's Encrypt 正式發布,已經保護 380 萬個域名

關於Linux防火牆iptables的面試問答
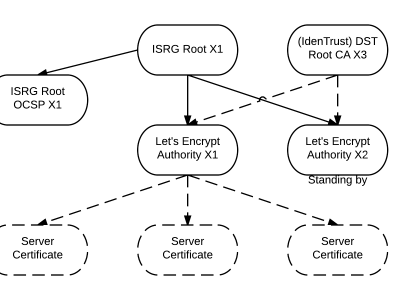
Lets Encrypt 已被所有主流瀏覽器所信任