如何記錄 Linux 的系統運行時間的統計信息

Linux/Unix 系統管理員對伺服器的系統運行時間有一種奇怪的痴迷。這裡有一個關於這個主題的 xkcd 漫畫,一個好的系統管理員是一股不可阻擋的力量,他佇立在你家貓咪博客的伺服器之前,對抗黑暗勢力。

我們可以使用 uptime 命令或 [w 命令](https://www.cyberciti.biz//www.cyberciti.biz/faq/unix-linux-w-command-examples-syntax-usage-2/ "See Linux/Unix w command examples for more info") 或 top 命令來判斷 Linux 系統運行了多久。我可以使用 tuptime 工具保留每次重新啟動的運行時間,以獲得系統運行時間的歷史和統計報告。
這就像 uptime 命令一樣,但輸出結果更令人印象深刻。最近我發現了另一種稱為 uptimed 的工具,用於記錄關於機器的系統運行時間和統計信息。讓我們看看如何使用 Linux 操作系統上的 uptimed 和 uprecords 來獲得運行時間的記錄統計信息。
查找系統運行時間非常簡單,只需在基於 Linux 的系統上鍵入以下命令即可:
$ uptime -p
up 2 weeks, 4 days, 7 hours, 28 minutes
要保留有關 uptime 的歷史統計信息,請使用 tuptime 或 uptimed 工具。
安裝 uptimed
安裝 uptimed 的最簡單的方式是通過你的軟體包管理器,比如 apt/apt-get/yum 這些你的 Linux 發行版的朋友。
在 Debian/Ubuntu Linux 上安裝 uptimed
鍵入以下 [apt 命令](https://www.cyberciti.biz//www.cyberciti.biz/faq/ubuntu-lts-debian-linux-apt-command-examples/ "See Linux/Unix apt command examples for more info")/[apt-get 命令](https://www.cyberciti.biz//www.cyberciti.biz/tips/linux-debian-package-management-cheat-sheet.html "See Linux/Unix apt-get command examples for more info"):
$ sudo apt-get install uptimed
示例輸出:
Reading package lists... Done
Building dependency tree
Reading state information... Done
The following additional packages will be installed:
  libuptimed0
The following NEW packages will be installed:
  libuptimed0 uptimed
0 upgraded, 2 newly installed, 0 to remove and 3 not upgraded.
Need to get 40.7 kB of archives.
After this operation, 228 kB of additional disk space will be used.
Do you want to continue? [Y/n] y
Get:1 http://mirrors.linode.com/ubuntu xenial/universe amd64 libuptimed0 amd64 1:0.3.17-4 [9,050 B]
Get:2 http://mirrors.linode.com/ubuntu xenial/universe amd64 uptimed amd64 1:0.3.17-4 [31.6 kB]
Fetched 40.7 kB in 0s (2,738 kB/s)
Preconfiguring packages ...
Selecting previously unselected package libuptimed0.
(Reading database ... 39163 files and directories currently installed.)
Preparing to unpack .../libuptimed0_1%3a0.3.17-4_amd64.deb ...
Unpacking libuptimed0 (1:0.3.17-4) ...
Selecting previously unselected package uptimed.
Preparing to unpack .../uptimed_1%3a0.3.17-4_amd64.deb ...
Unpacking uptimed (1:0.3.17-4) ...
Processing triggers for systemd (229-4ubuntu21) ...
Processing triggers for ureadahead (0.100.0-19) ...
Processing triggers for man-db (2.7.5-1) ...
Setting up libuptimed0 (1:0.3.17-4) ...
Setting up uptimed (1:0.3.17-4) ...
Processing triggers for libc-bin (2.23-0ubuntu9) ...
Processing triggers for systemd (229-4ubuntu21) ...
Processing triggers for ureadahead (0.100.0-19) ...
在 CentOS/RHEL/Fedora/Oracle/Scientific Linux 上安裝 uptimed
$ sudo yum -y install epel-release
然後,鍵入以下 [yum 命令](https://www.cyberciti.biz//www.cyberciti.biz/faq/rhel-centos-fedora-linux-yum-command-howto/ "See Linux/Unix yum command examples for more info"):
$ sudo yum install uptimed
示例輸出:
Loaded plugins: fastestmirror
Loading mirror speeds from cached hostfile
 * base: centos.excellmedia.net
 * epel: ftp.cuhk.edu.hk
 * extras: centos.excellmedia.net
 * updates: centos.excellmedia.net
Resolving Dependencies
--> Running transaction check
---> Package uptimed.x86_64 0:0.4.0-6.el7 will be installed
--> Finished Dependency Resolution

Dependencies Resolved

===============================================================================
 Package           Arch             Version               Repository      Size
===============================================================================
Installing:
 uptimed           x86_64           0.4.0-6.el7           epel            47 k

Transaction Summary
===============================================================================
Install  1 Package

Total download size: 47 k
Installed size: 98 k
Is this ok [y/d/N]: y
Downloading packages:
uptimed-0.4.0-6.el7.x86_64.rpm                            |  47 kB   00:01
Running transaction check
Running transaction test
Transaction test succeeded
Running transaction
  Installing : uptimed-0.4.0-6.el7.x86_64                                  1/1
  Verifying  : uptimed-0.4.0-6.el7.x86_64                                  1/1

Installed:
  uptimed.x86_64 0:0.4.0-6.el7

Complete!
如果你正在使用 Fedora Linux,運行以下 dnf 命令:
$ sudo dnf install uptimed
在 Arch Linux 上安裝 uptimed
鍵入以下 pacman 命令:
$ sudo pacman -S uptimed
在 Gentoo Linux 上安裝 uptimed
鍵入以下 emerge 命令:
$ sudo emerge --ask uptimed
如何配置 uptimed
使用文本編輯器編輯 /etc/uptimed.conf 文件,例如 vim 命令:
$ sudo vim /etc/uptimed.conf
最少設置一個 email 地址來發送記錄。假定有個兼容 sendmail 的 MTA 安裝在 /usr/lib/sendmail。
EMAIL=vivek@server1.cyberciti.biz
保存並關閉文件。
如何在系統啟動時啟動 uptimed 服務?
使用 systemctl 命令啟動 uptimed 服務:
$ sudo systemctl enable uptimed
我該如何 啟動/停止/重啟 或者查看 uptimed 服務的狀態?
$ sudo systemctl start uptimed ## start it ##
$ sudo systemctl stop uptimed ## stop it ##
$ sudo systemctl restart uptimed ## restart it ##
$ sudo systemctl status uptimed ## view status ##
示例輸出:
● uptimed.service - uptime record daemon
   Loaded: loaded (/lib/systemd/system/uptimed.service; enabled; vendor preset: enabled)
   Active: active (running) since Thu 2017-11-09 17:49:14 UTC; 18min ago
 Main PID: 11137 (uptimed)
   CGroup: /system.slice/uptimed.service
           └─11137 /usr/sbin/uptimed -f

Nov 09 17:49:14 gfs04 systemd[1]: Started uptime record daemon.
如何查看 uptime 記錄
只需鍵入以下命令即可查看 uptimed(8) 程序的統計信息:
$ uprecords
示例輸出:

uprecords 有一些選項:
$ uprecords -?
示例輸出:
usage: uprecords [OPTION]...

  -?             this help
  -a             do not print ansi codes
  -b             sort by boottime
  -B             reverse sort by boottime
  -k             sort by sysinfo
  -K             reverse sort by sysinfo
  -d             print downtime seen before every uptimes instead of system
  -c             do not show current entry if not in top entries
  -f             run continously in a loop
  -s             do not print extra statistics
  -w             wide output (more than 80 cols per line)
  -i INTERVAL    use INTERVAL seconds for loop instead of 5, implies -f
  -m COUNT       show a maximum of top COUNT entries instead of 10
  -M             show next milestone
  -v             version information
結論
這是一個極好的小工具,可以顯示伺服器正常運行時間的記錄,以證明機器正常運行時間和你的業務連續性。在相關說明中,你可以看到官方的 XKCD 系統管理員 T恤 因為漫畫被製作成襯衫,其中包括背面的新插圖。

via: https://www.cyberciti.biz/hardware/see-records-statistics-about-a-linux-servers-uptime/
作者:Vivek Gite 譯者:MjSeven 校對:wxy
本文轉載來自 Linux 中國: https://github.com/Linux-CN/archive
對這篇文章感覺如何?
You may also like


More in:Linux中國

捐贈 Let's Encrypt,共建安全的互聯網
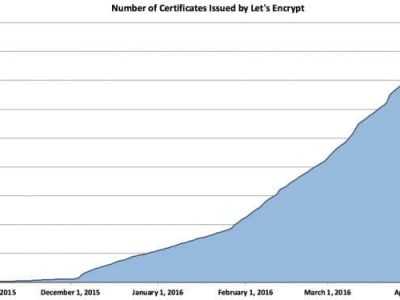
Let's Encrypt 正式發布,已經保護 380 萬個域名

關於Linux防火牆iptables的面試問答
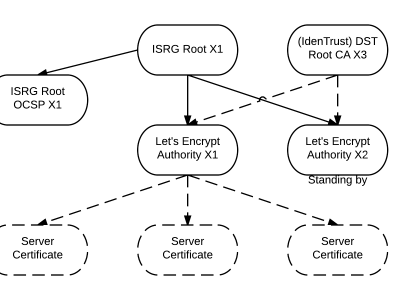
Lets Encrypt 已被所有主流瀏覽器所信任