Sysstat性能監控工具包中20個實用命令

今天,我們將會通過一些有趣的實例來學習mpstat, pidstat, iostat和sar等工具,這些工具可以幫組我們找出系統中的問題。這些工具都包含了不同的選項,這意味著你可以根據不同的工作使用不同的選項,或者根據你的需求來自定義腳本。我們都知道,系統管理員都會有點懶,他們經常去尋找一些更簡單的方法來完成他們的工作。
mpstat - 處理器統計信息
1.不帶任何參數的使用mpstat命令將會輸出所有CPU的平均統計信息
tecmint@tecmint ~ $ mpstat

Linux 3.11.0-23-generic (tecmint.com)   Thursday 04 September 2014  _i686_  (2 CPU)

12:23:57  IST  CPU    %usr   %nice    %sys %iowait    %irq   %soft  %steal  %guest  %gnice   %idle
12:23:57  IST  all   37.35    0.01    4.72    2.96    0.00    0.07    0.00    0.00    0.00   54.88
2.使用『-p』 (處理器編號)和『ALL』參數將會從0開始獨立的輸出每個CPU的統計信息,0表示第一個cpu。
tecmint@tecmint ~ $ mpstat -P ALL

Linux 3.11.0-23-generic (tecmint.com)   Thursday 04 September 2014  _i686_  (2 CPU)

12:29:26  IST  CPU    %usr   %nice    %sys %iowait    %irq   %soft  %steal  %guest  %gnice   %idle
12:29:26  IST  all   37.33    0.01    4.57    2.58    0.00    0.07    0.00    0.00    0.00   55.44
12:29:26  IST    0   37.90    0.01    4.96    2.62    0.00    0.03    0.00    0.00    0.00   54.48
12:29:26  IST    1   36.75    0.01    4.19    2.54    0.00    0.11    0.00    0.00    0.00   56.40
3.要進行『N』次,平均每次間隔n秒的輸出CPU統計信息,如下所示。
tecmint@tecmint ~ $ mpstat -P ALL 2 5

Linux 3.11.0-23-generic (tecmint.com)   Thursday 04 September 2014  _i686_  (2 CPU)

12:36:21  IST  CPU    %usr   %nice    %sys %iowait    %irq   %soft  %steal  %guest  %gnice   %idle
12:36:23  IST  all   53.38    0.00    2.26    0.00    0.00    0.00    0.00    0.00    0.00   44.36
12:36:23  IST    0   46.23    0.00    1.51    0.00    0.00    0.00    0.00    0.00    0.00   52.26
12:36:23  IST    1   60.80    0.00    3.02    0.00    0.00    0.00    0.00    0.00    0.00   36.18

12:36:23  IST  CPU    %usr   %nice    %sys %iowait    %irq   %soft  %steal  %guest  %gnice   %idle
12:36:25  IST  all   34.18    0.00    2.30    0.00    0.00    0.00    0.00    0.00    0.00   63.52
12:36:25  IST    0   31.63    0.00    1.53    0.00    0.00    0.00    0.00    0.00    0.00   66.84
12:36:25  IST    1   36.73    0.00    2.55    0.00    0.00    0.00    0.00    0.00    0.00   60.71

12:36:25  IST  CPU    %usr   %nice    %sys %iowait    %irq   %soft  %steal  %guest  %gnice   %idle
12:36:27  IST  all   33.42    0.00    5.06    0.25    0.00    0.25    0.00    0.00    0.00   61.01
12:36:27  IST    0   34.34    0.00    4.04    0.00    0.00    0.00    0.00    0.00    0.00   61.62
12:36:27  IST    1   32.82    0.00    6.15    0.51    0.00    0.00    0.00    0.00    0.00   60.51
(LCTT譯註: 上面命令中『2』 表示每2秒執行一次『mpstat -P ALL』命令, 『5』表示共執行5次)
4.使用『I』參數將會輸出每個處理器的中斷統計信息
tecmint@tecmint ~ $ mpstat -I

Linux 3.11.0-23-generic (tecmint.com)   Thursday 04 September 2014  _i686_  (2 CPU)

12:39:56  IST  CPU    intr/s
12:39:56  IST  all    651.04

12:39:56  IST  CPU        0/s        1/s        6/s        8/s        9/s       12/s       16/s       17/s       20/s       21/s       22/s       23/s       45/s       46/s       47/s      NMI/s      LOC/s      SPU/s      PMI/s      IWI/s      RTR/s      RES/s      CAL/s      TLB/s      TRM/s      THR/s      MCE/s      MCP/s      ERR/s      MIS/s
12:39:56  IST    0      76.27       1.73       0.00       0.00       0.42       0.33       0.00       0.06      11.46       0.00       0.00       0.01       7.62       1.87       0.05       0.33     182.26       0.00       0.33       3.03       0.00      22.66       0.16       5.14       0.00       0.00       0.00       0.00       0.00       0.00
12:39:56  IST    1      70.88       1.44       0.00       0.00       0.41       0.33       0.00      27.91      10.33       0.00       0.00       0.01       7.27       1.79       0.05       0.32     184.11       0.00       0.32       5.17       0.00      22.09       0.13       4.73       0.00       0.00       0.00       0.00       0.00       0.00

12:39:56  IST  CPU       HI/s    TIMER/s   NET_TX/s   NET_RX/s    BLOCK/s BLOCK_IOPOLL/s  TASKLET/s    SCHED/s  HRTIMER/s      RCU/s
12:39:56  IST    0       0.00     116.49       0.05       0.27       7.33       0.00       1.22      10.44       0.13      37.47
12:39:56  IST    1       0.00     111.65       0.05       0.41       7.07       0.00      56.36       9.97       0.13      41.38
5.使用『A』參數將會輸出上面提到的所有信息,等同於『-u -I All -p ALL』。
tecmint@tecmint ~ $ mpstat -A

Linux 3.11.0-23-generic (tecmint.com)   Thursday 04 September 2014  _i686_  (2 CPU)

12:41:39  IST  CPU    %usr   %nice    %sys %iowait    %irq   %soft  %steal  %guest  %gnice   %idle
12:41:39  IST  all   38.70    0.01    4.47    2.01    0.00    0.06    0.00    0.00    0.00   54.76
12:41:39  IST    0   39.15    0.01    4.82    2.05    0.00    0.02    0.00    0.00    0.00   53.95
12:41:39  IST    1   38.24    0.01    4.12    1.98    0.00    0.09    0.00    0.00    0.00   55.57

12:41:39  IST  CPU    intr/s
12:41:39  IST  all    651.73
12:41:39  IST    0    173.16
12:41:39  IST    1    225.89

12:41:39  IST  CPU        0/s        1/s        6/s        8/s        9/s       12/s       16/s       17/s       20/s       21/s       22/s       23/s       45/s       46/s       47/s      NMI/s      LOC/s      SPU/s      PMI/s      IWI/s      RTR/s      RES/s      CAL/s      TLB/s      TRM/s      THR/s      MCE/s      MCP/s      ERR/s      MIS/s
12:41:39  IST    0      76.04       1.77       0.00       0.00       0.41       0.36       0.00       0.06      11.60       0.00       0.00       0.01       7.42       1.83       0.05       0.34     182.89       0.00       0.34       2.97       0.00      22.69       0.16       5.22       0.00       0.00       0.00       0.00       0.00       0.00
12:41:39  IST    1      70.70       1.48       0.00       0.00       0.40       0.36       0.00      27.47      10.46       0.00       0.00       0.01       7.08       1.75       0.05       0.32     184.83       0.00       0.32       5.10       0.00      22.19       0.13       4.91       0.00       0.00       0.00       0.00       0.00       0.00

12:41:39  IST  CPU       HI/s    TIMER/s   NET_TX/s   NET_RX/s    BLOCK/s BLOCK_IOPOLL/s  TASKLET/s    SCHED/s  HRTIMER/s      RCU/s
12:41:39  IST    0       0.00     116.96       0.05       0.26       7.12       0.00       1.24      10.42       0.12      36.99
12:41:39  IST    1       0.00     112.25       0.05       0.40       6.88       0.00      55.05       9.93       0.13      41.20
pidstat - 進程和內核線程的統計信息
該命令是用於監控進程和當前受內核管理的線程。pidstat還可以檢查子進程和線程的狀態。
語法
# pidstat <OPTIONS> [INTERVAL] [COUNT]
6.不帶任何參數使用pidstat將會輸出所有活躍的任務。
tecmint@tecmint ~ $ pidstat
Linux 3.11.0-23-generic (tecmint.com)   Thursday 04 September 2014  _i686_  (2 CPU)

12:47:24  IST   UID       PID    %usr %system  %guest    %CPU   CPU  Command
12:47:24  IST     0         1    0.01    0.12    0.00    0.13     1  init
12:47:24  IST     0         3    0.00    0.01    0.00    0.01     0  ksoftirqd/0
12:47:24  IST     0         9    0.00    0.04    0.00    0.04     0  rcu_sched
12:47:24  IST     0        10    0.00    0.00    0.00    0.00     0  watchdog/0
12:47:24  IST     0        11    0.00    0.00    0.00    0.00     1  watchdog/1
12:47:24  IST     0        12    0.00    0.00    0.00    0.00     1  migration/1
12:47:24  IST     0        13    0.00    0.01    0.00    0.01     1  ksoftirqd/1
12:47:24  IST     0        23    0.00    0.00    0.00    0.00     0  kworker/u9:0
12:47:24  IST     0        29    0.00    0.61    0.00    0.61     0  kworker/0:1
12:47:24  IST     0        30    0.00    0.06    0.00    0.06     1  kworker/1:1
12:47:24  IST     0       224    0.00    0.01    0.00    0.01     1  jbd2/sda1-8
12:47:24  IST     0       360    0.00    0.00    0.00    0.00     1  upstart-udev-br
12:47:24  IST     0       365    0.01    0.00    0.00    0.01     0  systemd-udevd
12:47:24  IST     0       476    0.00    0.00    0.00    0.00     0  kworker/u9:1
7.使用『-p』(進程)參數輸出所有活躍和非活躍的任務。
tecmint@tecmint ~ $ pidstat -p ALL

Linux 3.11.0-23-generic (tecmint.com)   Thursday 04 September 2014  _i686_  (2 CPU)

12:51:55  IST   UID       PID    %usr %system  %guest    %CPU   CPU  Command
12:51:55  IST     0         1    0.01    0.11    0.00    0.12     1  init
12:51:55  IST     0         2    0.00    0.00    0.00    0.00     0  kthreadd
12:51:55  IST     0         3    0.00    0.01    0.00    0.01     0  ksoftirqd/0
12:51:55  IST     0         5    0.00    0.00    0.00    0.00     0  kworker/0:0H
12:51:55  IST     0         7    0.00    0.00    0.00    0.00     0  migration/0
12:51:55  IST     0         8    0.00    0.00    0.00    0.00     0  rcu_bh
12:51:55  IST     0         9    0.00    0.04    0.00    0.04     1  rcu_sched
12:51:55  IST     0        10    0.00    0.00    0.00    0.00     0  watchdog/0
12:51:55  IST     0        11    0.00    0.00    0.00    0.00     1  watchdog/1
12:51:55  IST     0        12    0.00    0.00    0.00    0.00     1  migration/1
12:51:55  IST     0        13    0.00    0.01    0.00    0.01     1  ksoftirqd/1
12:51:55  IST     0        15    0.00    0.00    0.00    0.00     1  kworker/1:0H
12:51:55  IST     0        16    0.00    0.00    0.00    0.00     1  khelper
12:51:55  IST     0        17    0.00    0.00    0.00    0.00     0  kdevtmpfs
12:51:55  IST     0        18    0.00    0.00    0.00    0.00     0  netns
12:51:55  IST     0        19    0.00    0.00    0.00    0.00     0  writeback
12:51:55  IST     0        20    0.00    0.00    0.00    0.00     1  kintegrityd
8.使用『-d 2』參數,我們可以看到I/O統計信息,2表示以秒為單位對統計信息進行刷新。這個參數可以方便的知道當系統在進行繁重的I/O時,那些進行佔用大量的資源的進程。
tecmint@tecmint ~ $ pidstat -d 2

Linux 3.11.0-23-generic (tecmint.com)   Thursday 04 September 2014  _i686_  (2 CPU)

03:26:53  EDT       PID   kB_rd/s   kB_wr/s kB_ccwr/s  Command

03:26:55  EDT       PID   kB_rd/s   kB_wr/s kB_ccwr/s  Command
03:26:57  EDT       574      0.00    148.00      2.00  miniserv.pl

03:27:01  EDT       PID   kB_rd/s   kB_wr/s kB_ccwr/s  Command
03:27:03  EDT         1      0.00      8.00      2.00  init
03:27:03  EDT       450      0.00      2.00      0.00  rsyslogd
03:27:03  EDT       534    138.00     10.00      4.00  crond
03:27:03  EDT     25100      0.00      6.00      0.00  sendmail
03:27:03  EDT     30829      0.00      6.00      0.00  java
9.想要每間隔2秒對進程4164的cpu統計信息輸出3次,則使用如下帶參數『-t』(輸出某個選定進程的統計信息)的命令。
tecmint@tecmint ~ $ pidstat -t -p 4164 2 3

Linux 3.11.0-23-generic (tecmint.com)   Thursday 04 September 2014  _i686_  (2 CPU)

01:09:06  IST   UID      TGID       TID    %usr %system  %guest    %CPU   CPU  Command
01:09:08  IST  1000      4164         -   22.00    1.00    0.00   23.00     1  firefox
01:09:08  IST  1000         -      4164   20.00    0.50    0.00   20.50     1  |__firefox
01:09:08  IST  1000         -      4171    0.00    0.00    0.00    0.00     0  |__Gecko_IOThread
01:09:08  IST  1000         -      4172    0.00    0.00    0.00    0.00     0  |__Socket
01:09:08  IST  1000         -      4173    0.00    0.00    0.00    0.00     0  |__JS
01:09:08  IST  1000         -      4174    0.00    0.00    0.00    0.00     0  |__JS
01:09:08  IST  1000         -      4175    0.00    0.00    0.00    0.00     0  |__Hang
01:09:08  IST  1000         -      4176    0.00    0.00    0.00    0.00     1  |__gdbus
01:09:08  IST  1000         -      4177    0.00    0.00    0.00    0.00     1  |__gmain
10.使用『-rh』參數,將會輸出進程的內存使用情況。如下命令每隔2秒刷新經常的內存使用情況。
tecmint@tecmint ~ $ pidstat -rh 2 3

Linux 3.11.0-23-generic (tecmint.com)   Thursday 04 September 2014  _i686_  (2 CPU)

#      Time   UID       PID  minflt/s  majflt/s     VSZ    RSS   %MEM  Command
 1409816695  1000      3958   3378.22      0.00  707420 215972   5.32  cinnamon
 1409816695  1000      4164    406.93      0.00 1252024 461404  11.36  firefox
 1409816695  1000      6676    168.81      0.00    4436    984   0.02  pidstat

#      Time   UID       PID  minflt/s  majflt/s     VSZ    RSS   %MEM  Command
 1409816697     0      1601    644.00      0.00  506728 316788   7.80  Xorg
 1409816697  1000      3958   3412.00      0.00  707420 215972   5.32  cinnamon
 1409816697  1000      4164   2667.00      0.00 1259576 471724  11.62  firefox
 1409816697  1000      6676    172.50      0.00    4436   1020   0.03  pidstat

#      Time   UID       PID  minflt/s  majflt/s     VSZ    RSS   %MEM  Command
 1409816699     0      1601    644.00      0.00  506728 316788   7.80  Xorg
 1409816699  1000      3958   4094.00      0.00  710148 218700   5.39  cinnamon
 1409816699  1000      4164    599.00      0.00 1261944 476664  11.74  firefox
 1409816699  1000      6676    168.00      0.00    4436   1020   0.03  pidstat
11.要使用『-G』參數可以輸出包含某個特定字元串的進程信息。如下命令輸出所有包含『VB』字元串的進程的統計信息,使用『-t』參數將線程的信息也進行輸出。
tecmint@tecmint ~ $ pidstat -G VB

Linux 3.11.0-23-generic (tecmint.com)   Thursday 04 September 2014  _i686_  (2 CPU)

01:09:06  IST   UID      PID      %usr  %system  %guest    %CPU   CPU   Command
01:09:08  IST  1000    1492     22.00     1.00       0.00        23.00     1        VBoxService
01:09:08  IST  1000    1902     4164      20.00      0.50        0.00       20.50       VBoxClient
01:09:08  IST  1000    1922     4171      0.00       0.00        0.00       0.00        VBoxClient
tecmint@tecmint ~ $ pidstat  -t -G VB
Linux 2.6.32-431.el6.i686 (tecmint) 09/04/2014 _i686_   (2 CPU)

03:19:52 PM   UID      TGID       TID    %usr %system  %guest    %CPU   CPU  Command
03:19:52 PM     0      1479         -    0.01    0.12    0.00    0.13     1  VBoxService
03:19:52 PM     0         -      1482    0.00    0.00    0.00    0.00     0  |__timesync
03:19:52 PM     0         -      1483    0.01    0.06    0.00    0.06     0  |__vminfo
03:19:52 PM     0         -      1485    0.00    0.01    0.00    0.01     1  |__memballoon
03:19:52 PM     0         -      1486    0.00    0.01    0.00    0.01     1  |__vmstats
03:19:52 PM     0         -      1487    0.00    0.05    0.00    0.05     0  |__automount
03:19:52 PM     0      1913         -    0.00    0.00    0.00    0.00     0  VBoxClient
03:19:52 PM     0         -      1913    0.00    0.00    0.00    0.00     0  |__VBoxClient
03:19:52 PM     0         -      1942    0.00    0.00    0.00    0.00     0  |__SHCLIP
03:19:52 PM     0      1933         -    0.04    0.89    0.00    0.93     0  VBoxClient
03:19:52 PM     0         -      1936    0.04    0.89    0.00    0.93     1  |__X11-NOTIFY
12.使用『-R』參數輸出實時的進程優先順序和調度信息。
tecmint@tecmint ~ $ pidstat -R

Linux 3.11.0-23-generic (tecmint.com)   Thursday 04 September 2014  _i686_  (2 CPU)

01:09:06  IST   UID      PID     prio      policy   Command
01:09:08  IST  1000    3         99        FIFO     migration/0
01:09:08  IST  1000    5         99          FIFO   migration/0
01:09:08  IST  1000    6         99          FIFO   watchdog/0
因為我們已經學習過iostat命令了,因此在本文中不在對其進行贅述。若想查看iostat命令的詳細信息,請參看「使用Iostat和Vmstat進行Linux性能監控」
sar - 系統活動報告
我們可以使用『sar』命令來獲得整個系統性能的報告。這有助於我們定位系統性能的瓶頸,並且有助於我們找出這些煩人的性能問題的解決方法。
Linux內核維護著一些內部計數器,這些計數器包含了所有的請求及其完成時間和I/O塊數等信息,sar命令從所有的這些信息中計算出請求的利用率和比例,以便找出瓶頸所在。
sar命令主要的用途是生成某段時間內所有活動的報告,因此,必需確保sar命令在適當的時間進行數據採集(而不是在午餐時間或者周末。)
13.下面是執行sar命令的基本用法。它將會在當前目錄下創建一個名為『sarfile』的文件。『-u』參數表示CPU詳細信息,5表示生產5次報告,2表示每次報告的時間間隔為2秒。
tecmint@tecmint ~ $ sar -u -o sarfile 2 5

Linux 3.11.0-23-generic (tecmint.com)   Thursday 04 September 2014  _i686_  (2 CPU)

01:42:28  IST     CPU     %user     %nice   %system   %iowait    %steal     %idle
01:42:30  IST     all     36.52      0.00      3.02      0.00      0.00     60.45
01:42:32  IST     all     43.32      0.00      5.04      0.00      0.00     51.64
01:42:34  IST     all     56.46      0.00      4.05      0.00      0.00     39.49
01:42:36  IST     all     44.44      0.00      3.79      0.00      0.00     51.77
01:42:38  IST     all     50.75      0.00      3.75      0.00      0.00     45.50
Average:        all     46.30      0.00      3.93      0.00      0.00     49.77
14.在上面的例子中,我們交互的執行sar命令。sar命令也提供了使用cron進行非交互的執行sar命令的方法,使用/usr/local/lib/sa1和/usr/local/lib/sa2腳本(如果你在安裝時使用了/usr/local作為前綴的話)
- /usr/local/lib/sa1是一個可以使用cron進行調度生成二進位日誌文件的shell腳本。
- /usr/local/lib/sa2是一個可以將二進位日誌文件轉換為用戶可讀的編碼方式。
使用如下Cron項目來將sar命令非交互化。
# 每10分鐘運行sa1腳本來採集數據
*/2 * * * * /usr/local/lib/sa/sa1 2 10

#在每天23:53時生成一個用戶可讀的日常報告
53 23 * * * /usr/local/lib/sa/sa2 -A
在sa1腳本的後端,sa1腳本會調用sabc(系統活動數據收集器,System Activity Data Collector)工具採集特定時間間隔內的數據。sa2腳本會調用sar來將二進位日誌文件轉換為用戶可讀的形式。
15.使用『-q』參數來檢查運行隊列的長度,所有進程的數量和平均負載
tecmint@tecmint ~ $ sar -q 2 5

Linux 3.11.0-23-generic (tecmint.com)   Thursday 04 September 2014  _i686_  (2 CPU)

02:00:44  IST   runq-sz  plist-sz   ldavg-1   ldavg-5  ldavg-15   blocked
02:00:46  IST         1       431      1.67      1.22      0.97         0
02:00:48  IST         4       431      1.70      1.23      0.97         0
02:00:50  IST         2       431      1.70      1.23      0.97         0
02:00:52  IST         2       431      1.70      1.23      0.97         0
02:00:54  IST         0       431      1.64      1.23      0.97         0
Average:            2       431      1.68      1.23      0.97         0
16.使用『-F』參數查看當前掛載的文件系統的使用統計信息
tecmint@tecmint ~ $ sar -F 2 4

Linux 3.11.0-23-generic (tecmint.com)   Thursday 04 September 2014  _i686_  (2 CPU)

02:02:31  IST  MBfsfree  MBfsused   %fsused  %ufsused     Ifree     Iused    %Iused FILESYSTEM
02:02:33  IST      1001       449     30.95    1213790475088.85  18919505    364463      1.89 /dev/sda1

02:02:33  IST  MBfsfree  MBfsused   %fsused  %ufsused     Ifree     Iused    %Iused FILESYSTEM
02:02:35  IST      1001       449     30.95    1213790475088.85  18919505    364463      1.89 /dev/sda1

02:02:35  IST  MBfsfree  MBfsused   %fsused  %ufsused     Ifree     Iused    %Iused FILESYSTEM
02:02:37  IST      1001       449     30.95    1213790475088.85  18919505    364463      1.89 /dev/sda1

02:02:37  IST  MBfsfree  MBfsused   %fsused  %ufsused     Ifree     Iused    %Iused FILESYSTEM
02:02:39  IST      1001       449     30.95    1213790475088.86  18919505    364463      1.89 /dev/sda1

Summary      MBfsfree  MBfsused   %fsused  %ufsused     Ifree     Iused    %Iused FILESYSTEM
Summary          1001       449     30.95    1213790475088.86  18919505    364463      1.89 /dev/sda1
17.使用『-n DEV』參數查看網路統計信息
tecmint@tecmint ~ $ sar -n DEV 1 3 | egrep -v lo

Linux 3.11.0-23-generic (tecmint.com)   Thursday 04 September 2014  _i686_  (2 CPU)

02:11:59  IST     IFACE   rxpck/s   txpck/s    rxkB/s    txkB/s   rxcmp/s   txcmp/s  rxmcst/s
02:12:00  IST     wlan0      8.00     10.00      1.23      0.92      0.00      0.00      0.00
02:12:00  IST    vmnet8      0.00      0.00      0.00      0.00      0.00      0.00      0.00
02:12:00  IST      eth0      0.00      0.00      0.00      0.00      0.00      0.00      0.00
02:12:00  IST    vmnet1      0.00      0.00      0.00      0.00      0.00      0.00      0.00
18.使用『-d』參數查看塊設備統計信息(與iostat類似)。
tecmint@tecmint ~ $ sar -d 1 3

Linux 3.11.0-23-generic (tecmint.com)   Thursday 04 September 2014  _i686_  (2 CPU)

02:13:17  IST       DEV       tps  rd_sec/s  wr_sec/s  avgrq-sz  avgqu-sz     await     svctm     %util
02:13:18  IST    dev8-0      0.00      0.00      0.00      0.00      0.00      0.00      0.00      0.00

02:13:18  IST       DEV       tps  rd_sec/s  wr_sec/s  avgrq-sz  avgqu-sz     await     svctm     %util
02:13:19  IST    dev8-0      0.00      0.00      0.00      0.00      0.00      0.00      0.00      0.00

02:13:19  IST       DEV       tps  rd_sec/s  wr_sec/s  avgrq-sz  avgqu-sz     await     svctm     %util
02:13:20  IST    dev8-0      7.00     32.00     80.00     16.00      0.11     15.43     15.43     10.80
19.使用『-r』參數輸出內存統計信息。
tecmint@tecmint ~ $ sar -r 1 3

Linux 3.11.0-23-generic (tecmint.com)   Thursday 04 September 2014  _i686_  (2 CPU)

02:14:29  IST kbmemfree kbmemused  %memused kbbuffers  kbcached  kbcommit   %commit  kbactive   kbinact   kbdirty
02:14:30  IST   1465660   2594840     63.90    133052   1549644   3710800     45.35   1133148   1359792       392
02:14:31  IST   1472724   2587776     63.73    133060   1549792   3715504     45.40   1125816   1360000       836
02:14:32  IST   1469112   2591388     63.82    133060   1550036   3705288     45.28   1130252   1360168       804
Average:      1469165   2591335     63.82    133057   1549824   3710531     45.34   1129739   1359987       677
20.使用『sadf -d』參數可以將數據導出為資料庫可以使用的格式。
tecmint@tecmint ~ $ safd -d /var/log/sa/sa20140903 -- -n DEV | grep -v lo

 # hostname;interval;timestamp;IFACE;rxpck/s;txpck/s;rxkB/s;txkB/s;rxcmp/s;txcmp/s;rxmcst/s;%ifutil
tecmint;2;2014-09-03 07:53:29 UTC;eth0;1.50;0.00;0.13;0.00;0.00;0.00;0.00;0.00
tecmint;2;2014-09-03 07:53:31 UTC;eth0;2.00;0.00;0.18;0.00;0.00;0.00;0.00;0.00
tecmint;2;2014-09-03 07:53:33 UTC;eth0;1.00;0.00;0.09;0.00;0.00;0.00;0.00;0.00
tecmint;2;2014-09-03 07:53:35 UTC;eth0;2.00;0.00;0.18;0.00;0.00;0.00;0.00;0.00
tecmint;14778;2014-09-03 11:59:54 UTC;eth0;1.78;1.17;1.10;0.18;0.00;0.00;0.00;0.00
tecmint;2;2014-09-03 11:59:56 UTC;eth0;3.50;3.00;0.60;0.77;0.00;0.00;0.00;0.00
tecmint;2;2014-09-03 11:59:58 UTC;eth0;0.00;0.00;0.00;0.00;0.00;0.00;0.00;0.00
tecmint;2;2014-09-03 12:00:00 UTC;eth0;0.00;0.00;0.00;0.00;0.00;0.00;0.00;0.00
tecmint;2;2014-09-03 12:00:02 UTC;eth0;0.50;0.50;0.48;0.03;0.00;0.00;0.00;0.00
tecmint;2;2014-09-03 12:00:04 UTC;eth0;2.50;3.50;0.21;2.05;0.00;0.00;0.00;0.00
tecmint;2;2014-09-03 12:00:06 UTC;eth0;1.49;1.00;0.62;0.06;0.00;0.00;0.00;0.00
tecmint;2;2014-09-03 12:00:08 UTC;eth0;0.50;0.00;0.03;0.00;0.00;0.00;0.00;0.00
tecmint;2;2014-09-03 12:00:10 UTC;eth0;0.50;0.50;0.03;0.04;0.00;0.00;0.00;0.00
tecmint;2;2014-09-03 12:00:12 UTC;eth0;1.00;0.50;0.12;0.04;0.00;0.00;0.00;0.00
你也可以將這些數據存儲在一個csv文檔中,然後繪製成圖表展示方式,如下所示
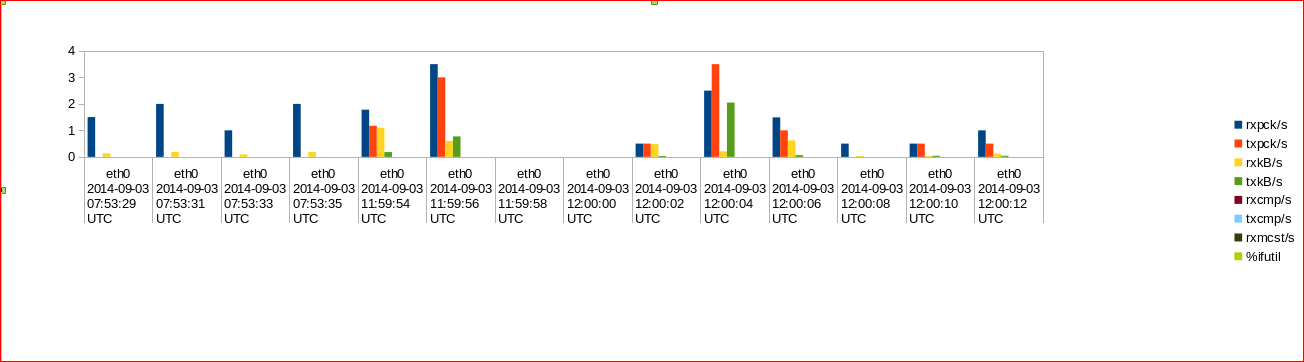
網路信息圖表
現在,你可以參考man手冊來後去每個參數的更多詳細信息,並且請在文章下留下你寶貴的評論。
via: http://www.tecmint.com/sysstat-commands-to-monitor-linux/
作者:Kuldeep Sharma 譯者:cvsher 校對:wxy
本文轉載來自 Linux 中國: https://github.com/Linux-CN/archive
對這篇文章感覺如何?
You may also like


More in:Linux中國

捐贈 Let's Encrypt,共建安全的互聯網
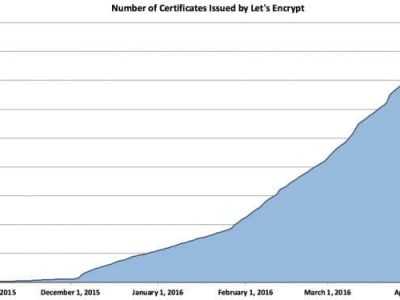
Let's Encrypt 正式發布,已經保護 380 萬個域名

關於Linux防火牆iptables的面試問答
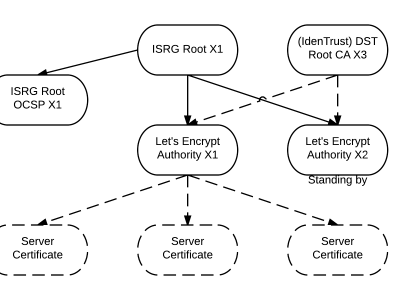
Lets Encrypt 已被所有主流瀏覽器所信任